… updated on Monday, October 13, 2025 09:17 +0200
netlab Graphs with Multi-Access Links
A netlab user wanted to create a nice-looking topology graph from a simple topology connecting a few devices to a broadcast (multi-access) link. I don’t have his exact topology, so we’ll use this one (skipping the details like setting device types)
nodes: [ r1, r2, h1, h2 ]

links:
- r1-r2
- interfaces: [ r1, r2, h1, h2 ]
This is what GraphViz generates based on netlab’s description of the lab topology:
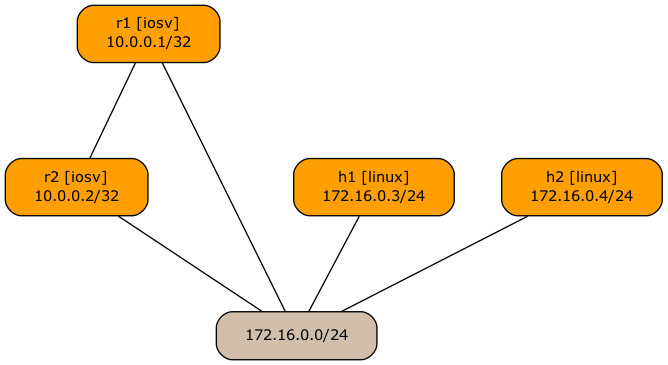
Initial representation of multi-access lab topology
I think we can agree that while the graph accurately represents the lab topology, it looks awful. Let’s start with the easy fix: R1 and R2 should be at the same level. I already described how we can use graph.rank to tell GraphViz that a set of nodes should be at the same level, so let’s add that to our lab topology:
---
groups:
  routers:
    members: [ r1, r2 ]
    device: iosv
    graph.rank: 1

nodes: [ r1, r2, h1, h2 ]

links:
- interfaces: [ r1, r2, h1, h2 ]
- r1-r2
Topology graph after adding graph.rank to router nodes
The results look better, but it would be much nicer to have the hosts below the multi-access subnet rounded box. The root cause of the “incorrect” placement of the host nodes is the order in which the graph edges are listed in the GraphViz graph description file. GraphViz assumes that nodes on the right side of a link should be below those on the left. We have to tell netlab to reverse the order of nodes within the h1–X_1 and h2–X_1 links.
 "r1" -- "X_1"
 "r2" -- "X_1"
 "h1" -- "X_1"
 "h2" -- "X_1"
 "r1" -- "r2"
That brings us to the too many nerd knobs territory. netlab has two attributes that influence GraphViz node placement and node ordering within a link: graph.rank and graph.linkorder. The default values of these attributes are 50 for nodes (devices) and interfaces, and 100 for multi-access links (subnets). No wonder the subnet boxes are always placed below the nodes.
The easiest way to get the graph in the right shape is to set graph.linkorder on the host interfaces:
links:
- r1:
  r2:
  h1:
    graph.linkorder: 200
  h2:
    graph.linkorder: 200
- r1-r2
That gives us the desired graph (below), but the link definition sure looks ugly. Can we do any better?
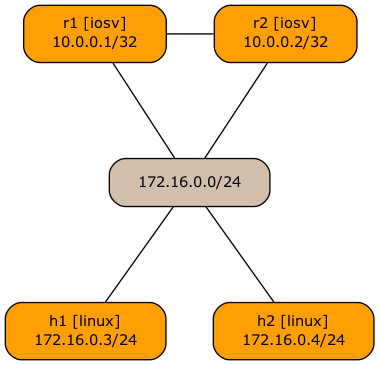
Topology graph after changing the graph.linkorder of host interfaces
Another idea would be to set the graph.rank of the link itself to a value between the router rank (1) and the default node rank (50).
links:
- interfaces: [ r1, r2, h1, h2 ]
  graph.rank: 2
- r1-r2
That doesn’t work because netlab sorts connections by graph.linkorder and only then by graph.rank. If a link and an interface have different graph.linkorder values (the default behavior to ensure the subnets are placed below nodes), the graph.rank values don’t matter.
However, what if we set the link graph.linkorder to the same value as the node graph.linkorder? Could we use graph.rank then?
links:
- interfaces: [ r1, r2, h1, h2 ]
  graph.linkorder: 50
  graph.rank: 2
- r1-r2
Unfortunately, that doesn’t work yet. Like most other link attributes, the graph.linkorder and graph.rank link attributes are copied to all connected interfaces, making them useless for sorting.
For the moment, we’re stuck with the ugly solution (set graph.linkorder on host interfaces), but I’ll do my best to have something better in one of the upcoming netlab releases.
Kicking The (Free) Tires
Want to try out various graph attributes? Use the procedure I described in the Changing Colors and Line Styles in netlab Graphs blog post, but start the GitHub Codespace from the netlab repository and use the tests/platform-integration/graph directory.