Capturing Traffic in Virtual Networking Labs
When I announced the Stub Networks in Virtual Labs blog post on LinkedIn, I claimed it was the last chapter in the “links in virtual labs” saga. I was wrong; here comes the fourth part of the virtual links trilogy – capturing “on the wire” traffic in virtual networking labs.
While network devices provide traffic capture capabilities (usually tcpdump in disguise generating a .pcap file), it’s often better to capture the traffic outside of the device to see what the root cause of the problems you’re experiencing might be.
Capturing Traffic on Libvirt Networks
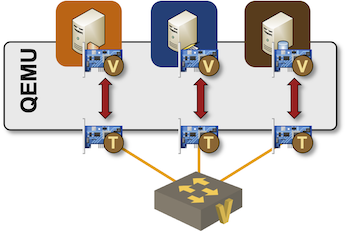
As discussed in Links in Virtual Labs, netlab uses a libvirt network to create a LAN segment, and libvirt implements networks with Linux bridges. Furthermore, each VM needs an interface attached to that bridge. QEMU implements those attachments with tap interfaces and shuffles traffic between the Linux tap interfaces and emulated VM interfaces:
Capturing traffic generated by QEMU-powered virtual machines connected to a Linux bridge is trivial; let me walk you through an example created with a simple netlab topology having three Linux VMs attached to a common segment:
provider: libvirt
defaults.device: linux

nodes: [ a, b, c ]
links: [ a-b-c ]
After starting the lab, we can see the Linux bridge and the connected interfaces:
$ virsh net-list
 Name              State    Autostart   Persistent
----------------------------------------------------
 default           active   yes         yes
 vagrant-libvirt   active   no          yes
 X_1               active   yes         yes
$ virsh net-info X_1
Name:           X_1
UUID:           68ead5e5-8c9d-4c7a-a788-e0a673d258d2
Active:         yes
Persistent:     yes
Autostart:      yes
Bridge:         virbr1
$ brctl show virbr1
bridge name	bridge id		STP enabled	interfaces
virbr1		8000.5254001743c2	no		vgif_a_1
							vgif_b_1
							vgif_c_1
Now that we know the names of the Linux interfaces serving the VM interfaces, we can capture traffic traversing a single interface or the whole LAN segment.
For example, when pinging A from B, we should see the ICMP packets on vgif_a_1, vgif_b_1 and virbr1 but not on vgif_c_1:
$ sudo tcpdump -i vgif_a_1 -c 5 -vv ip
tcpdump: listening on vgif_a_1, link-type EN10MB (Ethernet), snapshot length 262144 bytes
16:59:13.835860 IP (tos 0x0, ttl 64, id 30891, offset 0, flags [DF], proto ICMP (1), length 84)
    172.16.0.2 > 172.16.0.1: ICMP echo request, id 1670, seq 1, length 64
16:59:13.836114 IP (tos 0x0, ttl 64, id 3870, offset 0, flags [none], proto ICMP (1), length 84)
    172.16.0.1 > 172.16.0.2: ICMP echo reply, id 1670, seq 1, length 64
16:59:14.845327 IP (tos 0x0, ttl 64, id 31728, offset 0, flags [DF], proto ICMP (1), length 84)
    172.16.0.2 > 172.16.0.1: ICMP echo request, id 1670, seq 2, length 64
16:59:14.845685 IP (tos 0x0, ttl 64, id 4222, offset 0, flags [none], proto ICMP (1), length 84)
    172.16.0.1 > 172.16.0.2: ICMP echo reply, id 1670, seq 2, length 64
16:59:15.869352 IP (tos 0x0, ttl 64, id 32258, offset 0, flags [DF], proto ICMP (1), length 84)
    172.16.0.2 > 172.16.0.1: ICMP echo request, id 1670, seq 3, length 64
5 packets captured
6 packets received by filter
0 packets dropped by kernel

$ sudo tcpdump -i vgif_b_1 -c 3 -vv ip
tcpdump: listening on vgif_b_1, link-type EN10MB (Ethernet), snapshot length 262144 bytes
16:59:38.269277 IP (tos 0x0, ttl 64, id 43941, offset 0, flags [DF], proto ICMP (1), length 84)
    172.16.0.2 > 172.16.0.1: ICMP echo request, id 1671, seq 6, length 64
16:59:38.269658 IP (tos 0x0, ttl 64, id 13403, offset 0, flags [none], proto ICMP (1), length 84)
    172.16.0.1 > 172.16.0.2: ICMP echo reply, id 1671, seq 6, length 64
16:59:39.293336 IP (tos 0x0, ttl 64, id 44095, offset 0, flags [DF], proto ICMP (1), length 84)
    172.16.0.2 > 172.16.0.1: ICMP echo request, id 1671, seq 7, length 64
3 packets captured
4 packets received by filter
0 packets dropped by kernel

$ sudo tcpdump -i vgif_c_1 -c 3 -vv ip
tcpdump: listening on vgif_c_1, link-type EN10MB (Ethernet), snapshot length 262144 bytes
^C
0 packets captured
0 packets received by filter
0 packets dropped by kernel
$ sudo tcpdump -i virbr1 -c 3 -vv ip
tcpdump: listening on virbr1, link-type EN10MB (Ethernet), snapshot length 262144 bytes
16:59:50.557321 IP (tos 0x0, ttl 64, id 48456, offset 0, flags [DF], proto ICMP (1), length 84)
    172.16.0.2 > 172.16.0.1: ICMP echo request, id 1671, seq 18, length 64
16:59:50.557723 IP (tos 0x0, ttl 64, id 19680, offset 0, flags [none], proto ICMP (1), length 84)
    172.16.0.1 > 172.16.0.2: ICMP echo reply, id 1671, seq 18, length 64
16:59:51.581310 IP (tos 0x0, ttl 64, id 48532, offset 0, flags [DF], proto ICMP (1), length 84)
    172.16.0.2 > 172.16.0.1: ICMP echo request, id 1671, seq 19, length 64
3 packets captured
4 packets received by filter
0 packets dropped by kernel
That Sounds Complex
You’re right. It is. That’s why netlab provides a convenient wrapper around the virsh/brctl/tcpdump sequence. netlab capture command takes a node name and an interface name (using the names used by network devices), finds the Linux interface associated with the VM interface, and starts the tcpdump process.
Add the Edgeshark tool to netlab topology if you’re looking for a GUI interface displaying the Linux interfaces available for traffic capture with Wireshark.
Warning: Edgeshark tool definition is broken in netlab release 1.9.3 and 1.9.4. If you use one of them, use pip3 install --upgrade networklab to upgrade to release 1.9.5 or later.
In our scenario, we could simply use netlab capture a eth1 and add the tcpdump parameters:
$ netlab capture a eth1 -vv -c 3 ip
Starting packet capture on a/eth1: sudo tcpdump -i vgif_a_1 -vv -c 3 ip
tcpdump: listening on vgif_a_1, link-type EN10MB (Ethernet), snapshot length 262144 bytes
17:09:00.382163 IP (tos 0x0, ttl 64, id 59350, offset 0, flags [DF], proto ICMP (1), length 84)
    172.16.0.2 > 172.16.0.1: ICMP echo request, id 1671, seq 555, length 64
17:09:00.382460 IP (tos 0x0, ttl 64, id 29158, offset 0, flags [none], proto ICMP (1), length 84)
    172.16.0.1 > 172.16.0.2: ICMP echo reply, id 1671, seq 555, length 64
17:09:01.406191 IP (tos 0x0, ttl 64, id 59681, offset 0, flags [DF], proto ICMP (1), length 84)
    172.16.0.2 > 172.16.0.1: ICMP echo request, id 1671, seq 556, length 64
3 packets captured
4 packets received by filter
0 packets dropped by kernel
Capturing Container Traffic
You can use a similar trick to capture the traffic of containers attached to a Docker network (or a Linux bridge). We’ll use the same netlab topology with clab provider (starting Linux nodes as containers):
provider: clab
defaults.device: linux

nodes: [ a, b, c ]
links: [ a-b-c ]
containerlab does not use Docker networks. netlab has to create a Linux bridge and tell containerlab to connect the three containers to it:
name: X
prefix: "clab"

topology:
  nodes:
    a:
      kind: linux
    b:
      kind: linux
    c:
      kind: linux

    X_1:
      kind: bridge

  links:
  - endpoints:
    - "a:eth1"
    - "X_1:a_eth1"
  - endpoints:
    - "b:eth1"
    - "X_1:b_eth1"
  - endpoints:
    - "c:eth1"
    - "X_1:c_eth1"
The container connections to the Linux bridge are implemented with vEth pairs. The topology is almost identical to the one QEMU uses to connect virtual machines to the Linux bridges; the only difference is the mechanism used to implement the link between the VM/container interfaces and the Linux bridge interfaces.
We can thus use the brctl show command to display interfaces connected to the X_1 bridge and use tcpdump to capture their traffic:
$ brctl show X_1
bridge name	bridge id		STP enabled	interfaces
X_1		8000.363f459a1c59	no		a_eth1
							b_eth1
							c_eth1
However, as we’re using containers, we can do something better: execute a Linux command directly within the container namespace. containerlab creates user-friendly network namespaces, and we can use the ip netns command to list the container interfaces and ip netns exec command to execute tcpdump within a network namespace:
$ ip netns
clab-X-b
clab-X-a
clab-X-c
$ sudo ip netns exec clab-X-a ip link
1: lo: <LOOPBACK,UP,LOWER_UP> mtu 65536 qdisc noqueue state UNKNOWN mode DEFAULT group default qlen 1000
    link/loopback 00:00:00:00:00:00 brd 00:00:00:00:00:00
10093: eth0@if10094: <BROADCAST,MULTICAST,UP,LOWER_UP> mtu 1500 qdisc noqueue state UP mode DEFAULT group default
    link/ether 02:42:c0:a8:79:65 brd ff:ff:ff:ff:ff:ff link-netnsid 0
10100: eth1@if10099: <BROADCAST,MULTICAST,UP,LOWER_UP> mtu 1500 qdisc noqueue state UP mode DEFAULT group default
    link/ether aa:c1:ab:8f:5c:6a brd ff:ff:ff:ff:ff:ff link-netnsid 0
$ sudo ip netns exec clab-X-a tcpdump -i eth1 -c 3 -vv ip
tcpdump: listening on eth1, link-type EN10MB (Ethernet), snapshot length 262144 bytes
17:21:43.521792 IP (tos 0x0, ttl 64, id 2506, offset 0, flags [DF], proto ICMP (1), length 84)
    172.16.0.2 > 172.16.0.1: ICMP echo request, id 12, seq 0, length 64
17:21:43.521825 IP (tos 0x0, ttl 64, id 65382, offset 0, flags [none], proto ICMP (1), length 84)
    172.16.0.1 > 172.16.0.2: ICMP echo reply, id 12, seq 0, length 64
17:21:44.522130 IP (tos 0x0, ttl 64, id 2725, offset 0, flags [DF], proto ICMP (1), length 84)
    172.16.0.2 > 172.16.0.1: ICMP echo request, id 12, seq 1, length 64
3 packets captured
4 packets received by filter
0 packets dropped by kernel
Yet again, you can use the netlab capture command to start tcpdump within the desired container network namespace:
$ netlab capture a eth1
Starting packet capture on a/eth1: sudo ip netns exec clab-X-a tcpdump -i eth1 -l -v
tcpdump: listening on eth1, link-type EN10MB (Ethernet), snapshot length 262144 bytes
17:22:43.891278 IP (tos 0x0, ttl 64, id 14171, offset 0, flags [DF], proto ICMP (1), length 84)
    172.16.0.2 > 172.16.0.1: ICMP echo request, id 13, seq 0, length 64
17:22:43.891289 IP (tos 0x0, ttl 64, id 6813, offset 0, flags [none], proto ICMP (1), length 84)
    172.16.0.1 > 172.16.0.2: ICMP echo reply, id 13, seq 0, length 64
17:22:44.891564 IP (tos 0x0, ttl 64, id 14377, offset 0, flags [DF], proto ICMP (1), length 84)
    172.16.0.2 > 172.16.0.1: ICMP echo request, id 13, seq 1, length 64
Capturing Traffic on Point-to-Point Container Links
As described in Point-to-Point Links in Virtual Labs, containerlab creates direct links between containers:
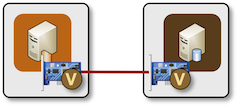
Direct point-to-point link between two containers
As the containers are no longer connected to a Linux bridge, we cannot capture the traffic on a connecting segment. The endpoints of the vEth pairs are also not visible in the “global” network namespace, but we already know the trick to use: use ip netns exec to execute tcpdump within the network namespace.
What About Libvirt Point-to-Point UDP Tunnels
Capturing traffic on container-to-container links is trivial. Can we do the same for VM-to-VM links implemented as QEMU UDP tunnels? We haven’t found a good solution yet; the UDP tunnels do not use Linux interfaces, so there’s no convenient interface we could use in the -i parameter of the tcpdump command.
In theory, one could:
- Capture the VM traffic based on UDP port numbers into a
.pcapfile - Modify the
.pcapfile with editcap to remove the first 42 bytes of each packet (Ethernet/IP/UDP headers) - Read the modified
.pcapfile with tcpdump or wireshark
This approach works but does not display the packets in real time. If you have a better idea, please leave a comment.
Revision History
- 2025-03-04
- Added pointers to Edgeshark based on the comment by Jaap de Vos
- Edgeshark tool definition is broken in netlab release 1.9.4. Added a downgrade netlab note.
- 2025-03-06
- Release 1.9.5 is out
Containerlab has the ability to integrate with Edgeshark. Edgeshark is an open source project by Siemens, it provides a web interface for most networking constructs found on your lab machine, allowing you to select them, start a capture, then pipe that to a local Wireshark installation. It’s easy to use, just grab a compose file and run it. There’s some required plumbing to perform beforehand, the whole process is documented pretty good in the Containerlab manual: https://containerlab.dev/manual/wireshark/
https://netlab.tools/extool/edgeshark/
tcpdump -w - [...filter...] | editcap -F libpcap -C 16 - - | tcpdump -nlvvv -r -
would allow one to display the UDP-stripped packets in real-time
Yeah, about that... I found it a while ago and tested it, and it works beautifully if you use regular files. It might have worked in real time in 2013 (when the answer was written), but it definitely does not produce anything (in real-time) on recent Ubuntus.
Looks like they optimized tcpdump or editcap a bit too much in the meantime.
I have just tested it on a still supported Ubuntu LTS, it seemed to "work" in general. ;-)
I'd expect buffering in the pipeline to be a problem for real-time output.
There are two
tcpdumpoptions that should help when added to the start of the pipeline:--immediate-modeand-U, --packet-buffered.The next possible problem is
editcap. I did not see any buffer control options in its man page, but one can try to usestdbuf -i0 -o0 editcap …to remove any buffering from its input and output streams.The last (
tcpdump) command in the pipeline already uses a buffer control option,-l.I did not test this, just wanted to provide pointers. ;-)