netlab Network Topology Graphs
A netlab user sent me an intriguing question: “Would it be possible to get network topology graphs out of the tool?”
I did something similar a long while ago for a simple network automation project (and numerous networking engineers built way more advanced stuff while attending the Building Network Automation Solutions course), so it seemed like a no-brainer. As always, things aren’t as easy as they look.
Creating a data structure that describes the network as a graph of nodes and links is trivial; the hard part is auto-placement – how do you position the nodes to make the graph look decent? While several tools can take a graph description in JSON or YAML format and even use networking icons to draw switches and routers, I haven’t found one (in that category) that would be able to solve the placement problem, so I had to rely on generic graph/diagram-generation tools: the venerable graphviz and the somewhat snazzier D2.
Contents |
The Basics
netlab can generate graph descriptions in Graphviz (.dot) and D2 (.d2) format. You have to install one or both of these packages (I use both) and then run them to generate the graphs (more below). The installation is trivial. I used homebrew on my macOS to install both; you can use the netlab install graph command if you want to install them on Ubuntu.
Graph Types
netlab can create three types of graphs:
- Topology (nodes and links), optionally clustering nodes into custom groups or autonomous systems
- BGP autonomous systems and BGP sessions
- IS-IS routing (nodes, links, stub networks)
The BGP graphs can be tailored with a few extra parameters:
- You can show VRF BGP sessions as dashed lines;
- You can use arrows on BGP sessions to see which routers are BGP route reflectors
- You can limit the graphed BGP sessions to global BGP sessions or to individual address families.
All graph types (and BGP goodies) are supported by both graph-description-generation engines (graph for GraphViz, d2 for D2).
Creating Graphs
netlab uses its output modules to generate graph description files. Those modules can be invoked with the netlab create command or with a dedicated (easier-to-use) netlab graph command. The netlab create command creates output files from a lab topology file; the netlab graph command uses a transformed snapshot file created by a previous netlab up or netlab create command.
I would recommend you create graphs with the netlab graph command after starting the lab. If you want to create a graph without starting the lab, execute netlab create -o pickle1 followed by netlab graph.
Creating GraphViz Graphs
The netlab graph command with no additional parameters creates a Graphviz description of the lab topology. For example, the following set of commands creates a simple network topology graph from one of the BGP examples:
netlab create -o pickle
netlab graph
dot graph.dot -T png -o netsim-graph-topo.png
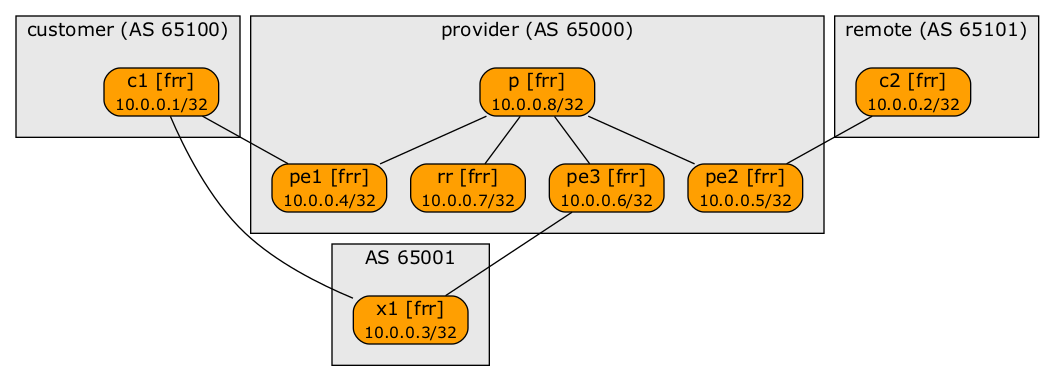
Lab topology (nodes and links)
Notes:
- netlab create -o pickle uses topology.yml as the default lab topology description, transforms the lab topology into devices/links/interfaces data structures, and saves the results in the netlab.snapshot.pickle file.
- netlab graph command reads the snapshot file and creates the graph description in
graph.dot. You can specify the desired graph description filename as a parameter of the netlab graph command. - dot is one of the graphviz graph drawing commands. You have to specify the graph description (graph.dot), output format (
-T png), and the output file name (-o filename). - Use
pngoutput format if you need a bitmap image to attach to a document or an email;svgformat is probably better if you want to create a diagram that will be displayed in a web browser.
Creating D2 Graphs
You can use the -e (or --engine) parameter of the netlab graph command to specify whether you want to have a GraphViz or D2 graph description. This is how you would create a D2 graph:
netlab create -o pickle
netlab graph -e d2
d2 graph.d2
Notes:
- d2 is the D2 graph drawing commands. You have to specify the graph description (graph.d2), and it assumes you want to get an SVG graph with the same name as the graph description file.
- You can specify the output file name as the second parameter of the d2 command. The file type of the output file specifies the image format you want to use. To create a PNG image, run
d2 graph.d2 graph.png - The default D2 layout engine creates curvy connections between nodes. You might want to try the ELK layout engine; use the
--layoutparameter (for example,d2 --layout elk graph.d2) to change the layout engine. - D2 can generate graphs that look somewhat hand-drawn. Use the
--sketchparameter (for example,d2 --sketch graph.d2) to generate them.
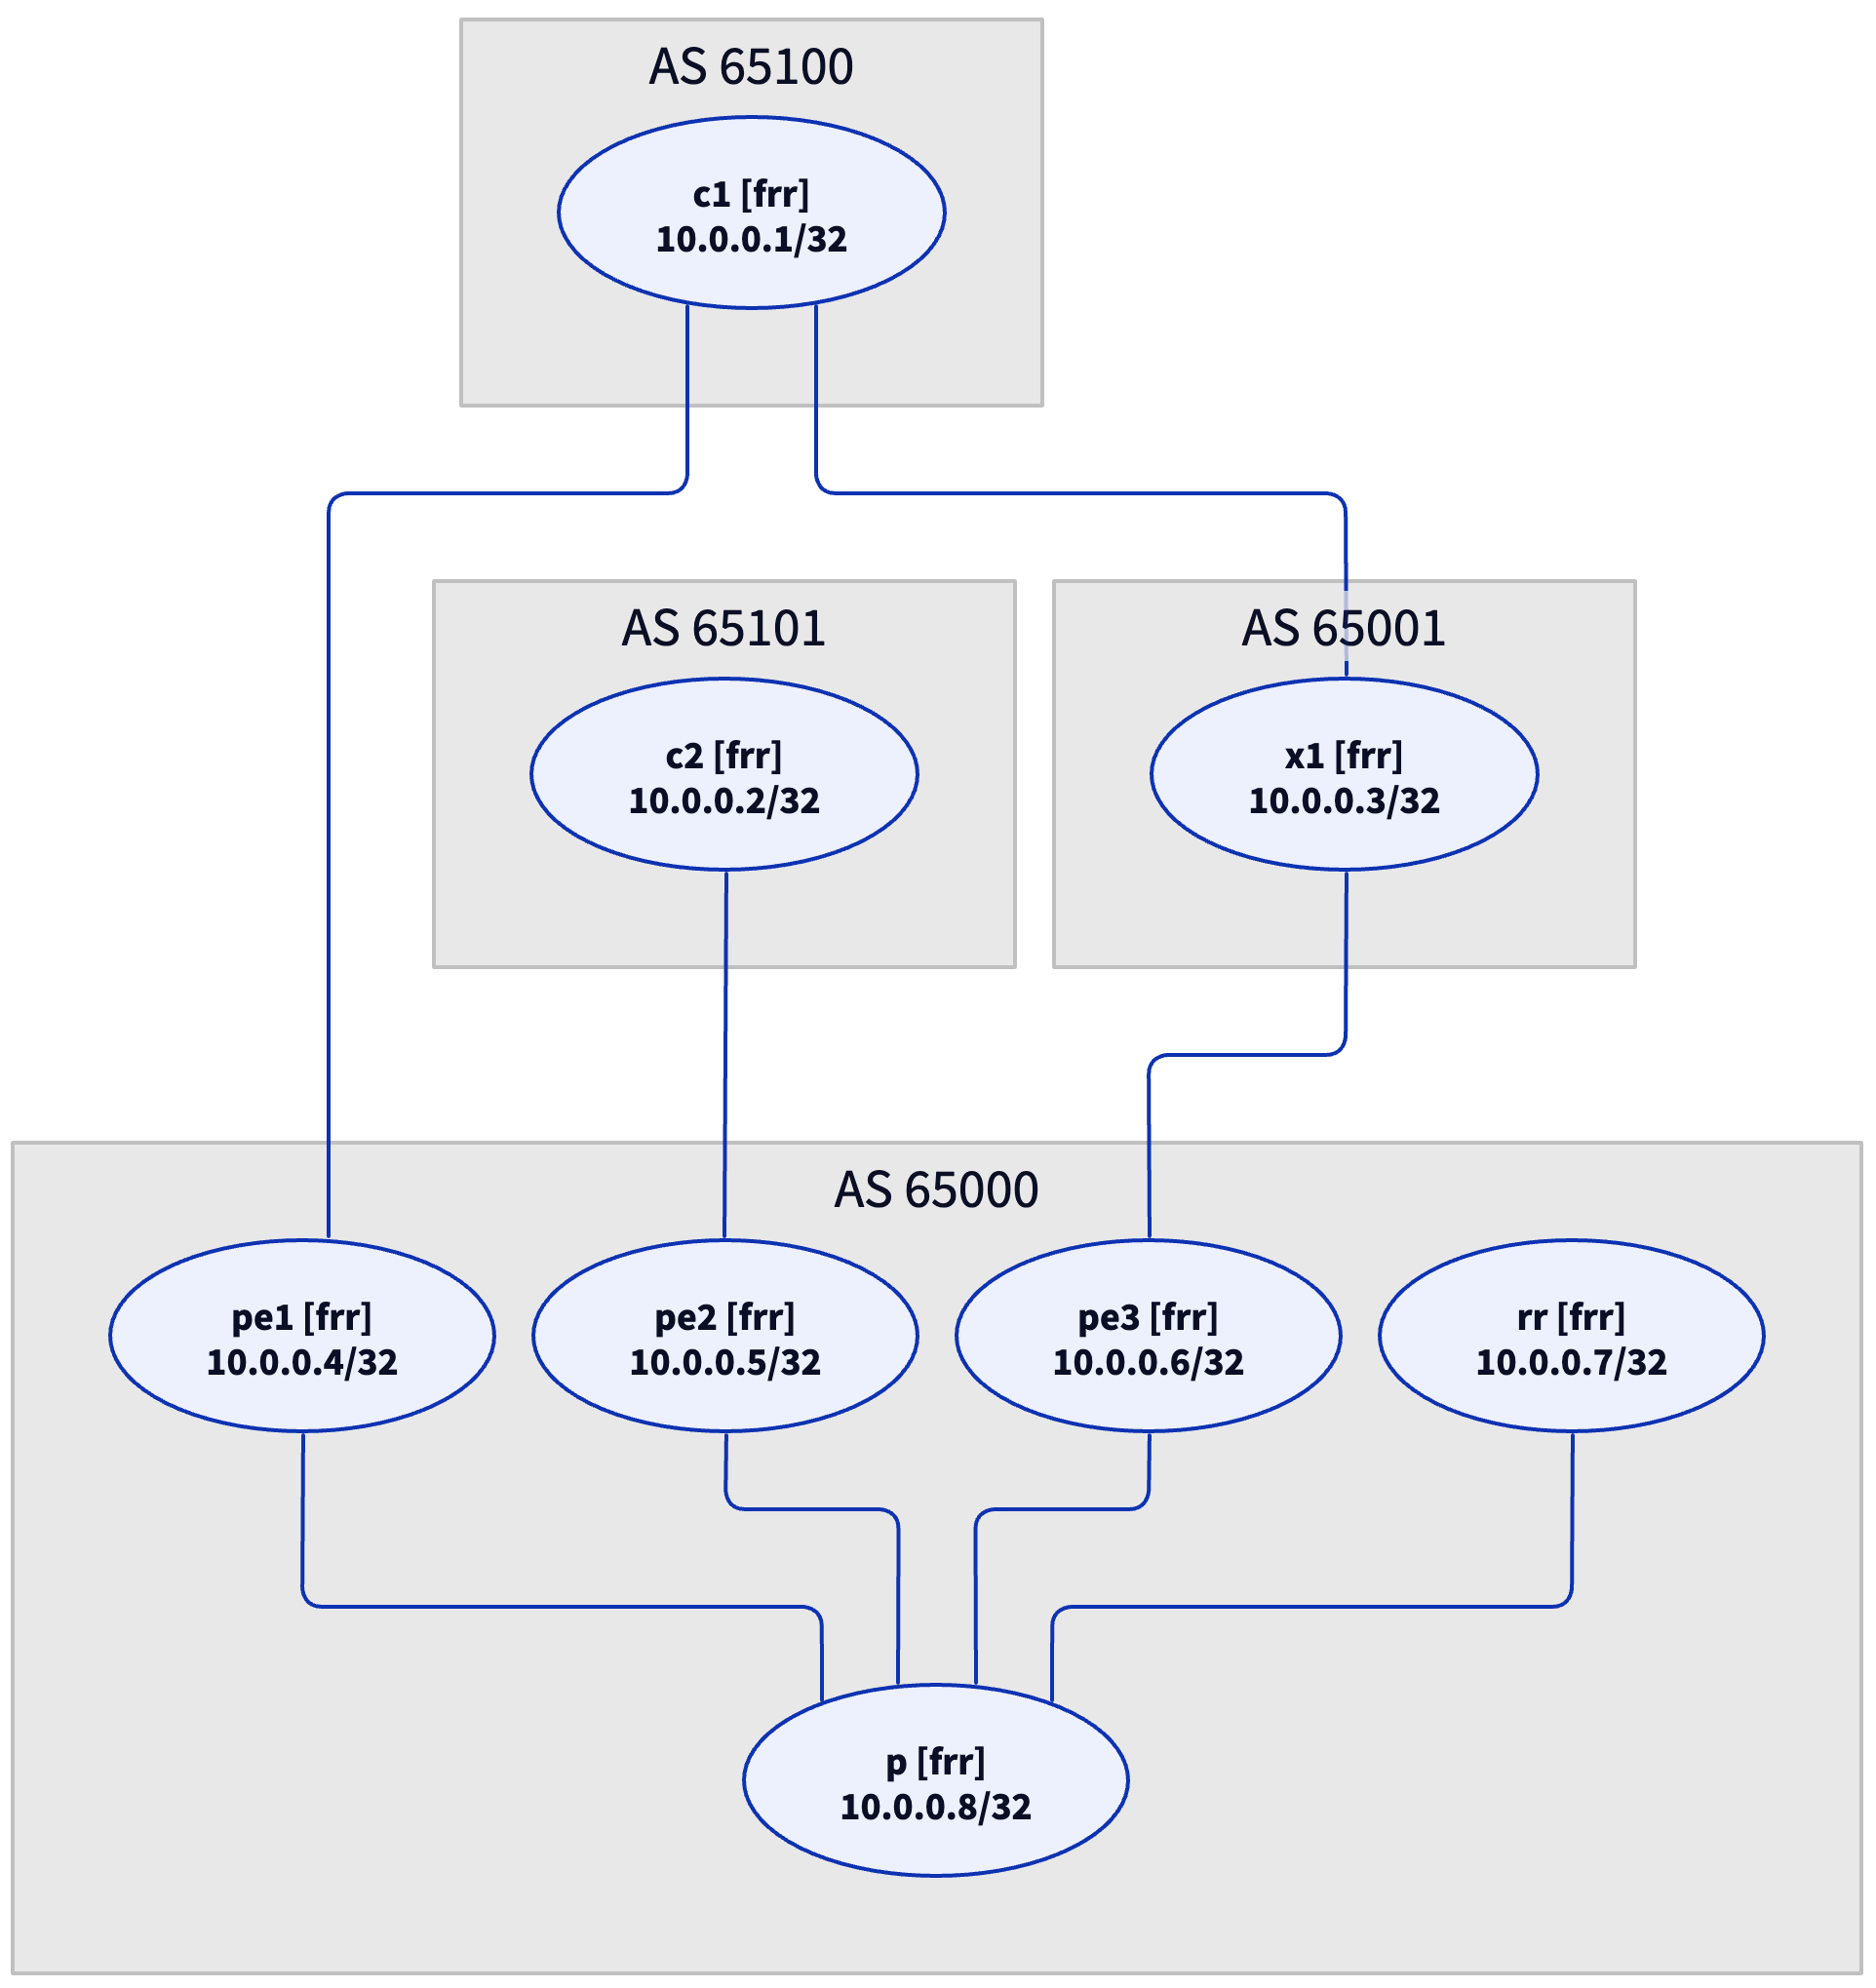
D2 graph of lab topology using ELK layout engine
Creating BGP and IS-IS Graphs
You can change the graph type with the -t (or --type) netlab graph parameter. It can take three values:
-t value |
Graph type |
|---|---|
| topology (default) | Lab topology (devices, links, and LAN segments) |
| bgp | BGP sessions |
| isis | IS-IS nodes, circuits (links), and stub networks |
For example, use the following commands to create a GraphViz graph of BGP sessions:
netlab graph --type bgp
dot graph.dot -T png -o netsim-graph-bgp.png
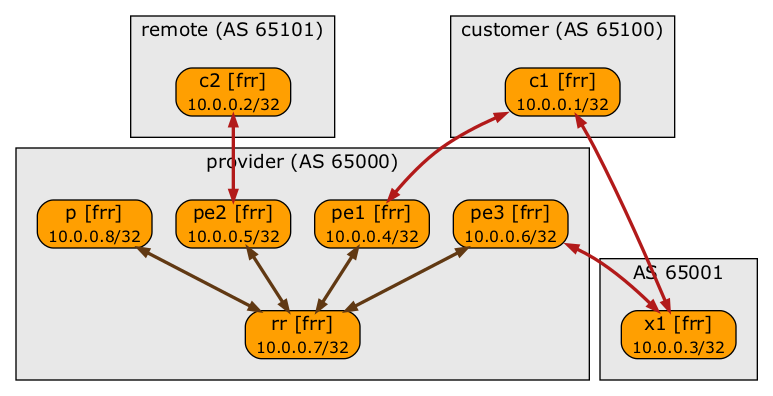
GraphViz graph of BGP sessions
You’ll find more details in the netlab documentation, in particular:
- The graph output module
- The d2 output module
- The netlab graph command
Revision History
- 2025-09-11
- Significant rewrite including:
- D2 graph description engine and D2 usage guidelines
- netlab graph command
- The pickle snapshot file introduced in netlab release 25.09
-
The pickle output format was introduced in netlab release 25.09. Use netlab create with older releases. ↩︎
From the viewpoint of someone with a networking background are there some books, videos or other material as a preparation to understand your (Python) code? Is there a documentation about your software design/philosophy? I saw that there are some comments in your code (no blaming) which help but it's still hard for me to follow.
I'm positive there are tons of good programming or software design/engineering books out there that will help you get started, but I wouldn't know what to recommend -- I went over some of those hurdles in 1980s.
Programming is not my core business, and so there's no documentation on my software design philosophy. On a somewhat tangential note, you wouldn't believe how many programmers claim there's no need for code comments because their code is obvious and self-documenting ;)
If you have any specific question just send it my way; if you'd like to implement a new feature in netsim-tools, open a GitHub issue and we'll go from there.