Changing Colors and Line Styles in netlab Graphs
Last week, I explained how to generate network topology graphs (using GraphViz or D2 graphing engines) from a netlab lab topology. Let’s see how we can make them look nicer (or at least more informative). We’ll work with a simple leaf-and-spine topology with four nodes1:
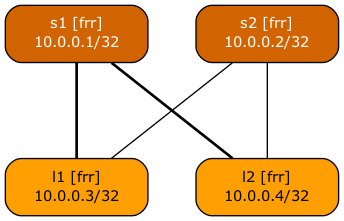
defaults.device: frr
provider: clab

nodes: [ s1, s2, l1, l2 ]
links: [ s1-l1, s1-l2, s2-l1, s2-l2 ]
This is the graph generated by netlab create followed by dot graph.dot -T png -o graph.png:
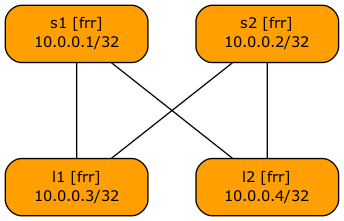
Baseline topology graph
What if we’d like to change the color of the spine devices so they stand out? netlab release 25.09 makes that trivial: use graph.fill attribute to change the node background color.
To make things a bit more interesting, we’ll use a netlab group to change these parameters for all spine nodes at once2, resulting in this lab topology:
defaults.device: frr
provider: clab

groups:
  spines:
    members: [ s1, s2 ]
    graph.fill: '#d26400'

nodes: [ s1, s2, l1, l2 ]
links: [ s1-l1, s1-l2, s2-l1, s2-l2 ]
Here’s the resulting graph:
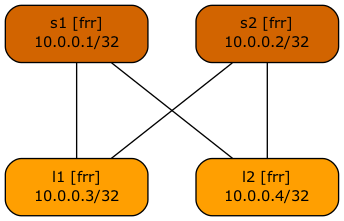
Spine nodes have a darker background color
The graph.fill and a few other attributes are used by GraphViz and D2 output modules, so you’ll get consistent colors regardless of which graphing engine you use. Here’s the equivalent D2 graph:
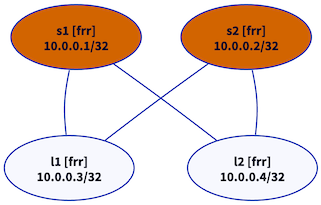
Node colors are applied to GraphViz and D2 graphs
Next, let’s assume that S2 is a backup switch3, and that the links S2-L1 and S2-L2 are slower than the other fabric links. We can use the graph.width attribute to change the link width. Here’s the improvement of our lab topology (this time using link groups).
defaults.device: frr
provider: clab

groups:
  spines:
    members: [ s1, s2 ]
    graph.fill: '#d26400'

nodes: [ s1, s2, l1, l2 ]

links:
- group: primary
  members: [ s1-l1, s1-l2 ]
  graph.width: 2
- group: backup
  members: [ s2-l1, s2-l2 ]
  graph.width: 1
Here’s the resulting graph:
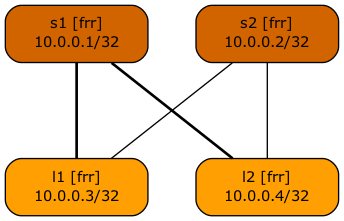
Primary links are wider
Finally, let’s try to do something that’s (currently) impossible with the netlab graph attributes: changing the text color. To do that, we have to define a new graph attribute and map it to a GraphViz attribute (more details)4.
We can do both with system defaults, first defining a new attribute…
defaults.outputs.graph.attributes.node.textcolor: str
… and then mapping the textcolor node attribute into Graphviz fontcolor attribute:
defaults.outputs.graph.style_map.textcolor: fontcolor
Now we can add graph.textcolor to the spines group, resulting in this lab topology:
defaults.outputs.graph.attributes.node.textcolor: str
defaults.outputs.graph.style_map.textcolor: fontcolor

defaults.device: frr
provider: clab

groups:
  spines:
    members: [ s1, s2 ]
    graph.fill: '#d26400'
    graph.textcolor: white

nodes: [ s1, s2, l1, l2 ]

links:
- group: primary
  members: [ s1-l1, s1-l2 ]
  graph.width: 2
- group: backup
  members: [ s2-l1, s2-l2 ]
  graph.width: 1
And here’s the final spiffed-up graph:
White text looks nicer on a dark background
For more details, explore other graph-related netlab articles and the documentation for the:
Kicking The (Free) Tires
Want to try out the graphs? This is how you can create them in GitHub Codespaces:
- Start a codespace from the
netlab-examplesrepository - When the codespace starts, execute netlab install graph in the terminal window
- Change the directory to
graphs/colors-lineswith cd graphs/colors-lines
Now you’re ready to create and view the graphs:
- Transform one of the YAML files in that directory with netlab create -o pickle topology.
- Create a graph description file with netlab graph.
- Create an SVG graph with dot graph.dot -T svg -o graph.svg, or a PNG graph with dot graph.dot -T png -o graph.png.
- Start a web server in your codespace with python3 -m http.server. The GitHub Codespaces orchestration code automatically detects a new application port and asks whether you want to open it in your browser. If you do, a new browser tab will be connected to the in-container HTTP server.
- Open graph.svg from the directory listing and enjoy the new graph.
- Switch back to the devcontainer browser tab, open a new terminal window in it (you’re running a web server in the original terminal window), modify the topology files, and repeat the above process to create modified graphs.
Finally, don’t forget to stop the codespace. You only get 60 free hours per month.
-
What (based on a true story) some vendors would sell you instead of two leaf switches, or a single, somewhat larger switch. And of course, the fabric has to be based on EBGP because RFC 7938. ↩︎
-
Remember: copy-paste makes rockets explode ↩︎
-
For whatever weird reason, maybe the customer ran out of budget and couldn’t afford two decent spine switches. ↩︎
-
Admittedly, from the D2 documentation, but the same approach works for GraphViz graphs. ↩︎