Latency: the Killer of Spread-Out Application Stack Ideas
A few months ago I described how bandwidth limitations shatter the dreams of spread-out application stacks with elements residing (or being dynamically migrated) between data centers. Today let’s focus on bandwidth’s ugly cousin: latency.
TL&DR Summary: Spreading the server components of an application across multiple locations (multiple data centers or hybrid cloud deployments) can easily result in dismal performance even when there’s plenty of bandwidth available.
Before We Start
It’s always possible to throw more money at the problem and increase bandwidth available between your chosen data center locations. It’s impossible to reduce latency without (A) changing your ideas or (B) changing the laws of physics, and it seems some people believe in taking the option (B).
Back to the Basics
Most applications stacks deployed today have components residing in more than two hosts (or VMs or container); see the earlier blog post for details.
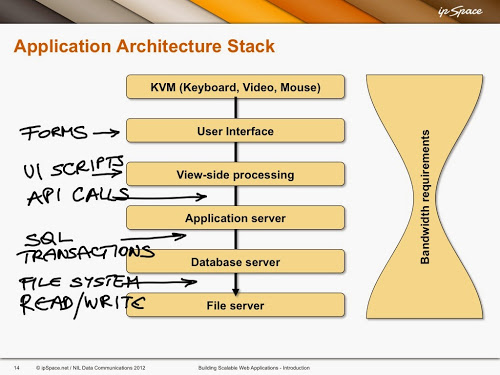
The interactions between a browser and one or more web servers are usually very well understood – this part of the application stack tends to have the lowest bandwidth and highest latency and is thus heavily optimized in well-performing web applications. For more details, watch excellent video by Ilya Grigorik, and read his book.
The other parts of the application stack usually get no scrutiny: latency within a data center is measured in microseconds, and is easy to ignore when things like compiling PHP scripts every time a web request is made take hundreds of milliseconds.
Now imagine you spread the components of the application stack across multiple locations (note: I’m far from claiming it makes sense), increasing the latency to tens of milliseconds. Will the application performance change? It depends – and the problem is that you usually have no data to figure it out.
The Problem
Latency, usually expressed in Round Trip Time (RTT) tends to be a real killer (for more details, watch my free TCP, HTTP and SPDY webinar):
- It takes one RTT just to establish a new TCP session;
- Another one (or more) RTT might be needed to negotiate SSL/TLS;
- Yet another RTT is spent sending the request and getting the first part of the reply;
- When the reply is longer than a few kilobytes, TCP slow start might kick in, requiring one or more extra RTT.
You might decide to ignore the RTT between (for example) a web server and a database server – after all, adding 20 – 50 msec of extra latency to a web request processing doesn’t seem like much. The real problem is that you don’t know how many SQL transactions (each one resulting in another round trip time) it takes to get the data out of the database.
Some applications are well written and try to minimize the number of SQL queries (or RPC or web services requests), but it’s not uncommon to see an application doing hundreds of SQL queries to get the data needed to generate a response to a single web request just because the application programmer never took time to figure out how SQL joins actually work (or because the application programmer believes in the magical powers of NoSQL databases that have no equivalent of SQL join).
Does It Matter?
As usual, a picture is worth a thousand words. Imagine that you could somehow measure the number of RTTs needed between individual components of the application stack to fulfill a typical client request; we’ll use the width of the boxes between components of the application stack to illustrate how chatty the components are.
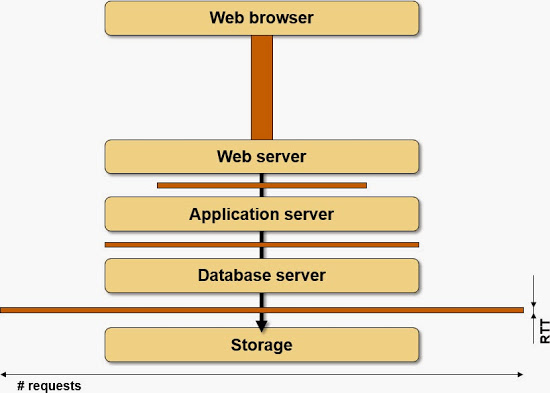
Requests in a typical application stack
Now imagine you insert extra latency between two components: you pull them apart, but the width of the boxes never changes, and the time wasted due to latency is the total surface area of all the boxes in the picture.
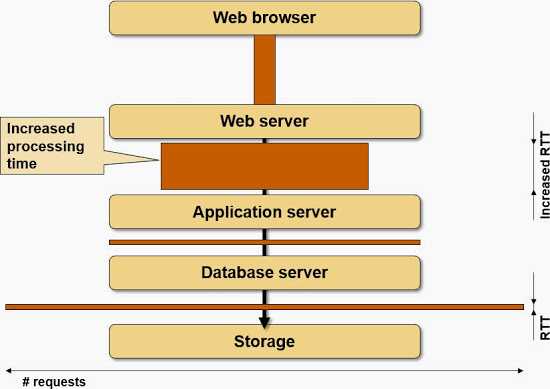
The impact of increased RTT
Can We Predict the Outcome?
Here’s the real bummer: measuring the total amount of data exchanged between application stack components is doable (just look at the Netflow data), but it’s really hard to measure the number of RTTs needed to fulfill a client request. Wireshark is probably your best bet. Am I missing something? Please write a comment!
Finally, you can always test the application under realistic conditions. Take something like WANem, insert it between the application stack components, and measure how well the application works when facing limited bandwidth, additional latency, and packet loss.
If the amount of RTTs is unknown but the amount of data that need to be send is known, divide the dataamount by 1460B(usable amount in TCP MSS) and into cwin/rwin limits to get the Roundtrip amount to fully send all data.