Create Network Diagram from LLDP Neighbor Information
One of the sample Ansible playbooks I published to help the attendees of my Building Network Automation Solutions course get started collects LLDP neighbor information on all managed devices and converts that information into a network diagram.
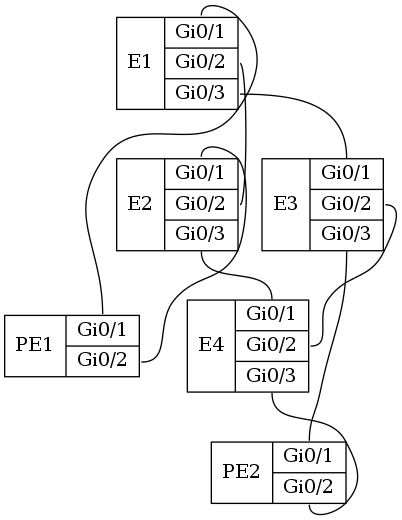
Here’s the graph I got from it when I ran it on my 6-node OSPF network (the Inter-AS VIRL topology from this repository). Please note I spent zero time tweaking the graph description (it shows).
If you need a detailed explanation of how that playbook works, you’ll find it here.
Recent updates
I recently updated the playbook to work with Ansible 2.4 and latest version of NAPALM and napalm-ansible (which changed the names of NAPALM-gathered device facts – really useful).
The playbook also supports either short names (rtr) or FQDNs (rtr.example.com) and interface names used by the network devices (GigabitEthernet0/1) or shortened ones (Gi0/1).
Trust Cisco to mess up your automation: Cisco IOS uses shortened interface names (Gi0/1) in LLDP advertisements while most everyone else uses the actual interface names used on the device.
1 comments: