The Magical U-curve and technology adoption
Simon Gordon introduced me to the magic U-curve during a fantastic meeting with the QFabric team more than a year ago. It turns out you can explain around 80% of IT phenomena with the U-curve (assuming you choose the proper metrics and linear or log scale) … and you can always try the hockey stick if the U-curve fails.
For example, it seems that every time a new IT technology appears, you could expect to see two types of people quickly adopting it:
- Small shops that have way more time than budget (and a geek or two that love to tinker with shiny new toys);
- The Facebooks, Amazons or Googles of the world that are quick to realize how they could benefit from the new technology and where the size of the potential savings quickly justifies the investment.
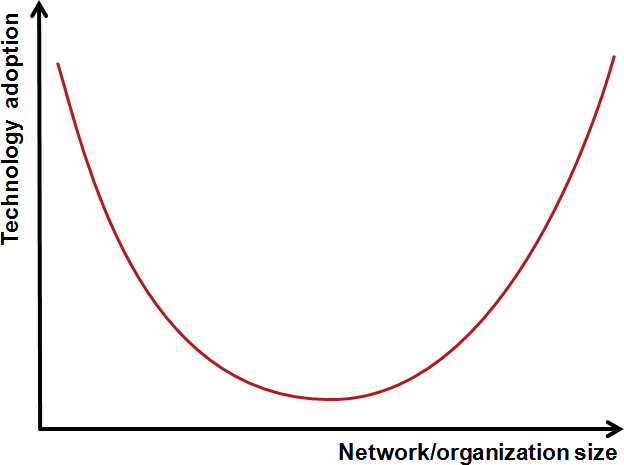
In the middle, you have the typical enterprise customers who are (a) risk averse, (b) not gaining as much by introducing the emerging technologies and (c) too busy fighting existing fires to be able to spend significant time on testing new solutions.
Amazingly, the same explanation works equally well for open-source software, cloud services, and SDN/OpenFlow.