Get the right troubleshooting tools for the job
A while ago Matthew Norwood wrote an excellent article describing the troubleshooting process they used to figure out why a particular web application worked way too slowly. Greg Ferro was quick to point out that it doesn’t make sense to assume the network is the problem and work through the whole chain slowly eliminating every potential networking device as the source of the problem when you might be facing an application design issue. However, there’s an even more important consideration: your network troubleshooting toolbox lacks the right troubleshooting tools for this job.
Loading a web page is a complex process that can generate tens of individual requests, sometimes going to the same server, sometimes spread over a number of CDN elements. Some requests block other requests (two JavaScript files cannot be loading at the same time), some requests block page rendering (the rendering will not start until all CSS files have been loaded). Before trying to analyze the individual components that can marginally influence the response time of each individual HTTP request it makes sense to look at the big picture: how many requests is the web page generating?
Some of the browsers have all the tools you need already built in:
- In Chrome, open the Developer Tools by right-clicking anywhere on the page and selecting Inspect element. The Network tab in the pop-up window gives you the request timeline.
- In Safari, you have to enable development tools in advanced preferences. After that, you can show Web Inspector from the Develop menu and enable resource tracking in the Resources tab.
- In Firefox, use the Firebug plug-in; you’ll find the timeline in the Net tab.
If you want to use a standalone browser-independent tool, download Fiddler, a proxy HTTP server that runs on your workstation, logs all HTTP requests and allows you to see them as a timeline or analyze each one of them.
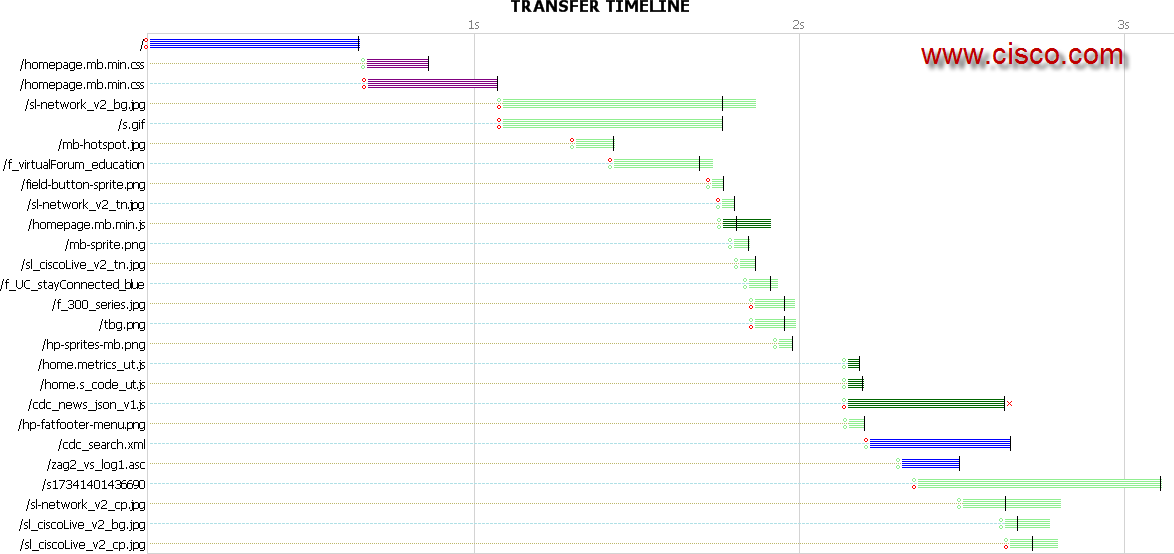
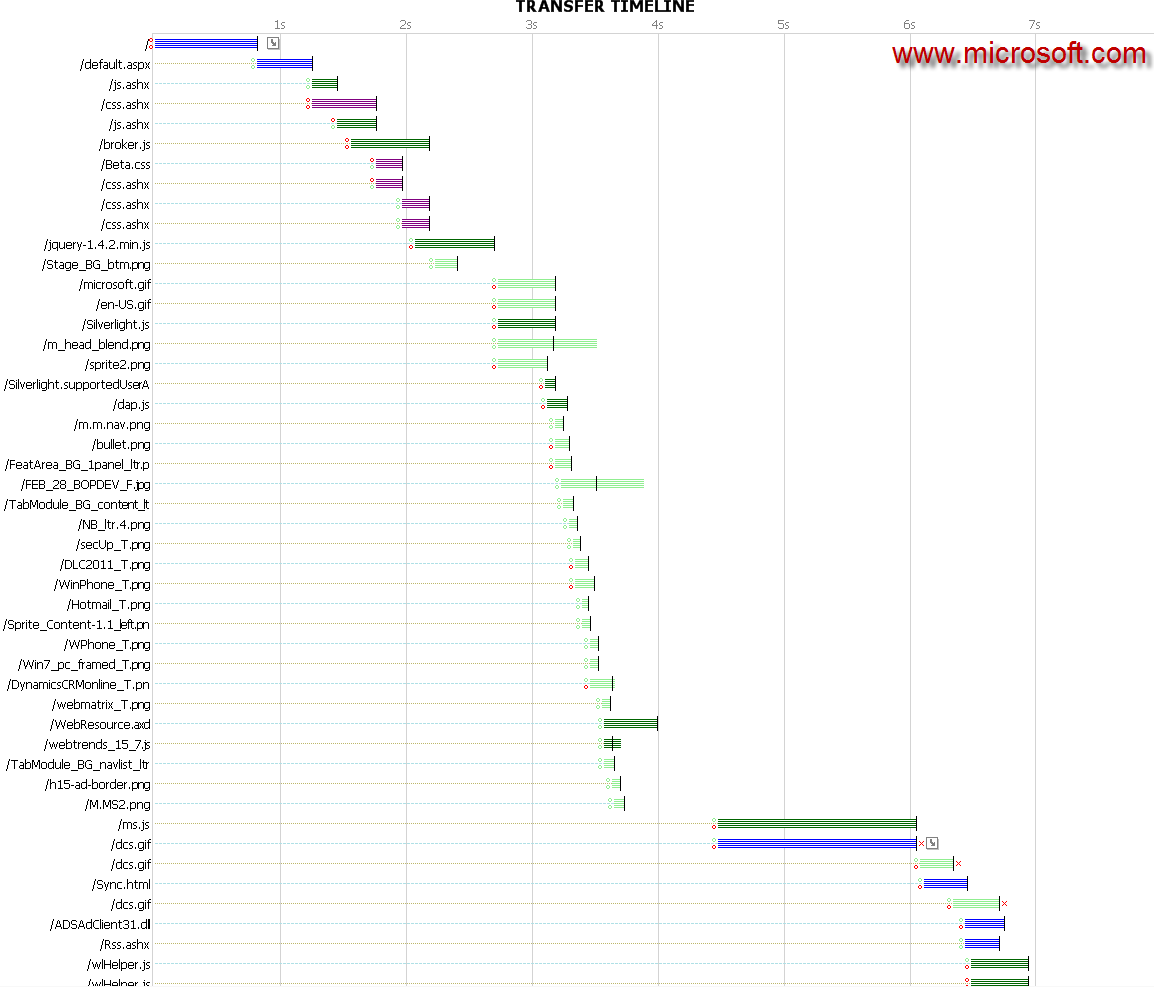
Regardless of the tool you use, the HTTP request/response timeline gives you a quick insight into web application behavior. For example, compare the redesigned Cisco’s home page to Microsoft’s:
After you’ve identified the main culprit (too many HTTP requests or slow response to individual HTTP requests), you can either send the application developers back to the drawing board or investigate individual requests. Most tools allow you to select an individual request from the timeline to inspect the details (in Fiddler, select the statistics tab). Here’s a sample printout from one of my applications where the server does a lot of SQL work before returning the response data.
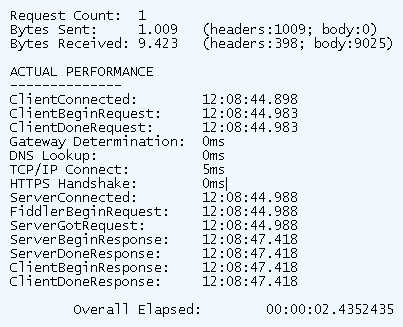
As you can see, you can analyze network latency (TCP connect time), server response time (delta time between ServerGotRequest and ServerBeginResponse), transfer time (between ServerBeginResponse and ServerDoneResponse) and local processing time (between ServerDoneResponse and ClientDoneResponse), yet again giving you the data you need to decide whether to go into network, server or application performance troubleshooting.
Update 2010-03-14 @ 12:20 UTC: Inserted browser-specific instructions. Thank you, Stew and IanH!
Preferences -> Advanced -> Show Develop Menu, then Develop -> Show Web Inspector -> Resources -> Enable Resource Tracking.
...I know...
Anyway it ended up being Trend Antivirus that we use on our desktops. Hmmm..you dont say, it wasn't the network?
MS also has the Visual Round Trip Analuzer tool that can be useful:
http://www.microsoft.com/downloads/en/details.aspx?FamilyID=119F3477-DCED-41E3-A0E7-D8B5CAE893A3&displaylang=en
Cheers,
Peter
5o9mm.com
Now, if I could only get a tool which would do the same thing for protocols like Netbios, SMB, and RPC.... =-X
interestingly enough fluke networks has software very similar to wireshark and much easier to use (it has pre-built filters for protocols etc). I believe it's called the ClearSight Analyzer, I've only seen demo's, but perhaps someone else could further enlighten using it as a TS tool. I thought it's combiner/merger feature of pcaps could be highly useful.